Part 3. Measure, then multiply
9 Read your numbers without fooling yourself
What shown, accepted and attributed revenue really mean, what a decent acceptance rate looks like, and the trap in the word shown.
The stats page answers one question: which offers are worth keeping. Everything else is decoration.
Three figures per offer
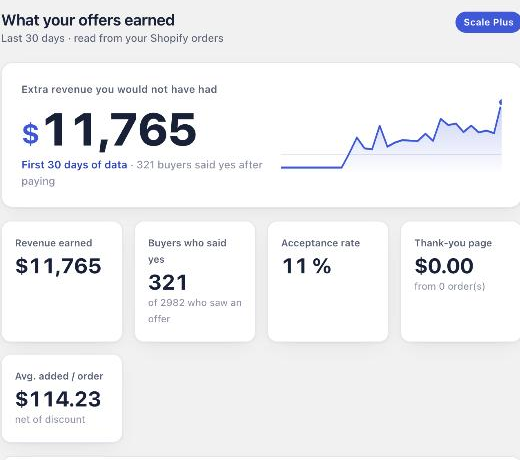
Shown. How many times the offer was served.
Accepted. How many times a buyer took it.
Revenue. What those acceptances added, at the price actually charged after the discount.
Accepted divided by shown is your acceptance rate, and it is the number to optimise. Revenue tells you whether the rate is worth anything: a 30 percent rate on a five euro item can matter less than a 6 percent rate on something worth eighty.
What counts as good
We will not hand you an industry benchmark, because the real answer is that it depends on your catalogue and your price ratio, and a made-up number would just make you feel bad or comfortable for no reason.
Compare against yourself instead. Your first offer sets the baseline. Everything after that is better or worse than it. That comparison is real, and it is the only one you can act on.
Bring back the eligibility figure from chapter 2 when you do it. An offer that reached 40 percent of your orders and was accepted by one in eight of the buyers who saw it is performing well, even though it touched a small slice of your total revenue.
What “shown” counts
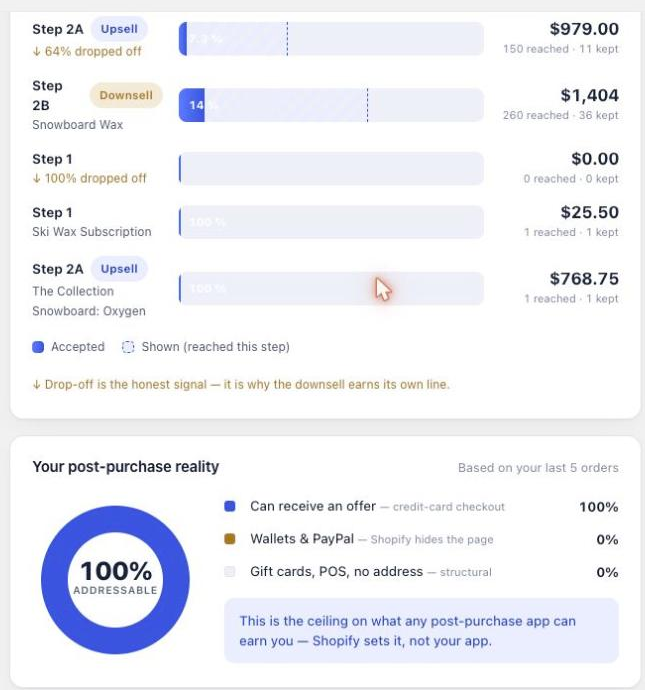
Shown means the page appeared on the buyer's screen. It is counted when the offer is displayed, not when Shopify asks for it in advance. A buyer paying with a wallet or iDEAL never sees the one-click page, so they never count as shown there.
Reading a single funnel
Each funnel has its own page, which shows the tree with the figures attached to each node. This is where the decline branch you built in chapter 6 proves itself or does not.
What you should have now
One offer you have decided to cut or replace, chosen from the numbers rather than from taste. That decision is the whole point of the page.
Last updated